ClickHouse Usage Tutorial Series
Article 1: Quick Start with ClickHouse
Article 1: Quick Start with ClickHouse
Overview
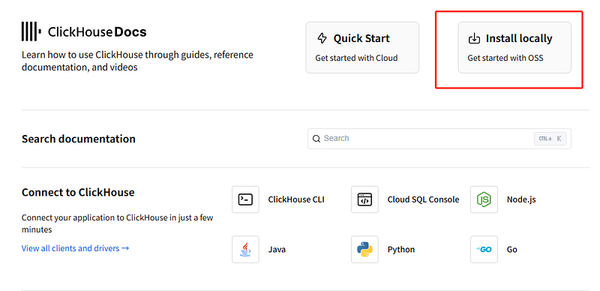
This article will guide you through a quick start with ClickHouse. You’ll learn how to download an appropriate binary for your OS, run the ClickHouse server, create a table, insert data into it, and query your table using the ClickHouse client.
Prerequisites
You’ll need curl or another command - line HTTP client to fetch the ClickHouse binary.
Download the binary
ClickHouse runs natively on Linux, FreeBSD, and macOS, and runs on Windows via the WSL. The simplest way to download ClickHouse locally is to run the following curl command:
1curl https://clickhouse.com/ | shYou should see:
Successfully downloaded the ClickHouse binary, you can run it as:    ./clickhouse
You can also install it:
 sudo ./clickhouse install
At this stage, you can ignore the prompt to run the install command.
Start the server
Run the following command to start the ClickHouse server:
1./clickhouse serverYou should see the terminal fill up with logging. This is expected as the default logging level in ClickHouse is set to trace rather than warning.
Start the client
Use clickhouse - client to connect to your ClickHouse service. Open a new terminal, change directories to where your clickhouse binary is saved, and run the following command:
1./clickhouse clientYou should see a smiling face as it connects to your service running on localhost.
Create a table
Use CREATE TABLE to define a new table. In ClickHouse, tables require an ENGINE clause. Use MergeTree to take advantage of the performance benefits of ClickHouse:
1CREATE TABLE test_table (
2    id UInt32,
3    name String
4) ENGINE = MergeTree()
5ORDER BY id;
Insert data
You can use the familiar INSERT INTO TABLE command. For example:
1INSERT INTO test_table (id, name) VALUES (1, 'John'), (2, 'Jane');Query the table
To query the table, you can use a simple SELECT statement:
1SELECT * FROM test_table;Article 2: Data Ingestion in ClickHouse
Introduction
ClickHouse integrates with a number of solutions for data integration and transformation. This article will introduce some common data ingestion tools.
Data Ingestion Tools
Data Ingestion ToolDescriptionAirbyteAn open — source data integration platform. It allows the creation of ELT data pipelines and is shipped with more than 140 out — of — the — box connectors.Apache SparkA multi — language engine for executing data engineering, data science, and machine learning on single — node machines or clusters.Amazon GlueA fully managed, serverless data integration service provided by Amazon Web Services (AWS) simplifying the process of discovering, preparing, and transforming data for analytics, machine learning, and application development.Azure SynapseA fully managed, cloud — based analytics service provided by Microsoft Azure, combining big data and data warehousing to simplify data integration, transformation, and analytics at scale using SQL, Apache Spark, and data pipelines.Apache BeamAn open — source, unified programming model that enables developers to define and execute both batch and stream (continuous) data processing pipelines.dbtEnables analytics engineers to transform data in their warehouses by simply writing select statements.dltAn open — source library that you can add to your Python scripts to load data from various and often messy data sources into well — structured, live datasets.FivetranAn automated data movement platform moving data out of, into and across your cloud data platforms.NiFiAn open — source workflow management software designed to automate data flow between software systems.VectorA high — performance observability data pipeline that puts organizations in control of their observability data.
Article 3: Query Optimization in ClickHouse
Understanding Query Performance
When considering performance optimization, the best time is when setting the data schema before importing data into ClickHouse for the first time. However, it’s difficult to predict how much your data will grow or what types of queries will be executed.
General Considerations
When ClickHouse executes a query, the following steps occur:
- Query Parsing and Analysis: The query is parsed and analyzed to generate a general query execution plan.
- Query Optimization: The query execution plan is optimized, unnecessary data is trimmed, and a query pipeline is built from the query plan.
- Query Pipeline Execution: Data is read and processed in parallel. This is the stage where ClickHouse actually performs query operations such as filtering, aggregating, and sorting.
- Final Processing: The results are merged, sorted, and formatted into the final result, then sent to the client.
Finding Slow Queries
By default, ClickHouse collects and records information about each executed query in the system.query_log table. You can find slow - running queries and display resource usage information for each query. For example, to find the five longest - running queries in the NYC taxi dataset:
1SELECT query, query_duration_ms, read_rows, memory_usage
2FROM system.query_log
3ORDER BY query_duration_ms DESC
4LIMIT 5;
Using EXPLAIN Statements
ClickHouse supports the EXPLAIN statement to understand how queries are executed. For example, EXPLAIN indexes = 1 shows the query plan, and EXPLAIN PIPELINE shows the specific execution strategy.
1EXPLAIN indexes = 1 SELECT * FROM nyc_taxi.trips_small_inferred WHERE speed > 30;Article 4: Monitoring ClickHouse
Monitoring in ClickHouse Cloud
The monitoring data in ClickHouse Cloud can be accessed through the built — in dashboard ($HOST:$PORT/dashboard, requires user and password) and directly in the main service console.
Metrics in the Dashboard
The built — in advanced observability dashboard shows the following metrics:
- Queries/second
- CPU usage (cores)
- Queries running
- Merges running
- Selected bytes/second
- IO wait
- CPU wait
- OS CPU Usage (userspace)
- OS CPU Usage (kernel)
- Read from disk
- Read from filesystem
- Memory (tracked)
- Inserted rows/second
- Total MergeTree parts
- Max parts for partition
Server Metrics
ClickHouse server has embedded instruments for self — state monitoring. You can track server events using server logs. Metrics can be found in the system.metrics, system.events, and system.asynchronous_metrics tables. You can configure ClickHouse to export metrics to Graphite or Prometheus. To monitor server availability, you can send an HTTP GET request to /ping. For cluster configurations, use /replicas_status.
Article 5: Backup and Restore in ClickHouse
Background
Replication in ClickHouse protects against hardware failures but not human errors. To mitigate possible human errors, you should prepare a backup and restore strategy in advance.
Backup to a Local Disk
To configure a backup destination, add a file to /etc/clickhouse - server/config.d/backup_disk.xml specifying the disk and path. For example, the backup destination can be specified like Disk('backups', '1.zip').
Backup and Restore Commands
The general syntax for backup and restore commands is:
1BACKUP|RESTORE  TABLE [db.]table_name [AS [db.]table_name_in_backup]
2    [PARTITION[S] partition_expr [,...]] |
3  DICTIONARY [db.]dictionary_name [AS [db.]name_in_backup] |
4  DATABASE database_name [AS database_name_in_backup]
5    [EXCEPT TABLES ...] |
6  TEMPORARY TABLE table_name [AS table_name_in_backup] |
7  VIEW view_name [AS view_name_in_backup] |
8  ALL TEMPORARY TABLES [EXCEPT ...] |
9  ALL [EXCEPT ...] } [,...]
10  [ON CLUSTER 'cluster_name']
11  TO|FROM File('<path>/<filename>') | Disk('<disk_name>', '<path>/') | S3('<S3 endpoint>/<path>', '<Access key ID>', '<Secret access key>')
12  [SETTINGS base_backup = File('<path>/<filename>') | Disk(...) | S3('<S3 endpoint>/<path>', '<Access key ID>', '<Secret access key>')]
It’s important to note that if you back something up and never try to restore it, the restore process may not work properly when you actually need it. So, automate the restore process and practice it regularly on a spare ClickHouse cluster.